2. 长江师范学院化学化工学院, 重庆 408100
2. School of Chemistry and Chemical Engineering, Yangtze Normal University, Chongqing 408100, China
由于水具有安全、无毒、可再生能力强及溶解性能好的特点,被广泛应用于化工和医药等行业。在生产过程中,水和其他原料直接或间接的参与生产过程,会产生大量的含水共沸废液,如乙腈/水[1]、乙二胺/水[2]及四氢呋喃/水[3]等二元共沸物。为了实现资源循环利用及环境保护的目的,需要采用特殊精馏对其进行分离。
共沸特性数据是分离工艺设计、模拟及优化的基础。如果仅仅依靠实验来获取该类数据,会花费大量的时间和经济成本。相比之下,状态方程法[4-5]、活度系数法[6-7]、经验法[8-9]以及定量结构-性质关系(QSPR)模型[10-11]等理论计算方法就具有简单、快速的特点。目前,很多研究者利用理论计算方法预测了部分共沸物及混合物的相平衡数据,并取得了较好的效果[4, 7-8, 12-13]。但是,前3种方法在预测共沸物的共沸特性数据时,需要一些必要的实验参数或拟合参数,而通常这类参数的获取难度是比较大的。QSPR模型具有计算量小、耗时短及精度高等优点,而且相关所需参数均可由分子结构计算所得,并不需要任何额外的实验数据,被广泛应用于化工等领域[14-17],如Liang等从QSPR中探索变压蒸馏过程设计和动态控制的关系,且利用QSPR确定萃取精馏中溶剂对分离混合物相对挥发性的影响[18-20]。
基于此,本研究以125种含水二元共沸物为研究对象,利用定量结构-性质关系分别构建可以高精度预测含水二元共沸物共沸温度及组成的QSPR模型,以获取常压下该类共沸物的共沸特性数据;同时,也可为其他特殊种类二元共沸物共沸数据的预测提供参考和思路。
1 样本数据获取及分子描述符筛选 1.1 样本数据的获取为保证所建的QSPR模型不受数据源的影响,本文涉及到的125种含水二元共沸物的共沸特性数据均选自溶剂手册[21]。同时,本研究根据“Mixtures out”样本划分法[22]随机将整个数据集分为训练集(80%)和测试集(20%),以达到有效表征各类含水二元共沸物体系的目的,详见附件1表 1。其中,训练集用于筛选特征描述符及建立QSPR模型,测试集则用于评估所建模型的预测能力及泛化推广能力[13]。
1.2 分子结构的优化常见分子结构绘制和优化软件有Symyx Draw、HyperChem、Gauss和ChemOffice等[15, 23]。本研究采用HyperChem 8.0软件绘制和优化纯组分的三维分子结构以获取分子的最小能量构象。相关优化步骤如下:先通过分子力学方法(MM+)预优化;再由量子力学半经验方法(PM3)进一步优化。在优化过程中采用Polack-Ribiere算法,且所有计算在Hartree-Fock能级进行,至均方根梯度极限达到4.18×10⁷ kJ·m-1·mol-1[24]。
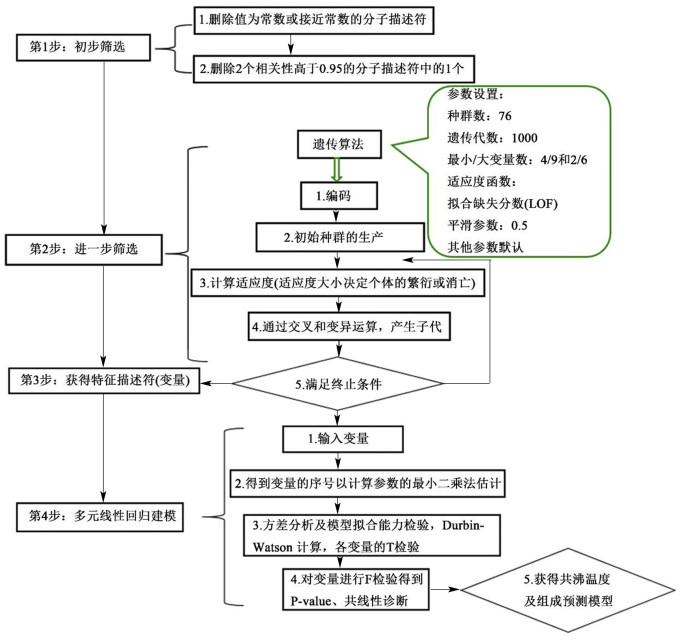
2 共沸温度及共沸组成QSPR模型 2.1 分子描述符的筛选与模型构建 2.1.1 分子描述符的筛选为准确的表征分子的结构特性,需要对分子描述符进行筛选,包括预筛选和进一步筛选,其筛选过程示意图如图 1所示。本研究利用Materials Studio 8.0软件计算纯物质的分子描述符,得到包括拓扑描述符、结构描述符及空间描述符等的15类共344种分子描述符;再以何培等选用的2个基本原则[25]对其进行预筛选,以消除无用及冗余信息,减少共线性出现的概率,经预筛选后得到76种分子描述符;再根据“Kay’s mixing rule”混合规则[26]计算得到二元共沸物的混合描述符,并采用遗传算法对其进一步筛选[27]。
|
| 图 1 特征描述符筛选及多元线性回归建模选示意图 Fig.1 A schematic diagram of feature descriptor screening and multiple linear regression modeling |
| |
经筛选后的混合描述符即可用于建立共沸温度及组成的QSPR模型,模型的构建过程如图 1所示。式(1)~(6)给出了不同混合描述符个数(4~9)的共沸温度预测模型,模型中的描述符以Ai表示;而式(7)~(11)给出了不同混合描述符个数(2~6)的共沸组成预测模型,模型中的描述符以Bi表示,表 1列出了建模所涉及的全部描述符。
| 共沸温度QSPR模型 | 共沸组成QSPR模型 | |||||
| 类型 | 变量 | 描述符 | 类型 | 变量 | 描述符 | |
| 结构描述符 | A9 | Hydrogen bond donor | 片段数 | B1 | Hydroxy | |
| 拓扑描述符 | A22 | Chi (4): path | 拓扑描述符 | B24 | Chi (5): cluster | |
| A24 | Chi (5): path/cluster | B26 | Chi (6): path/cluster | |||
| A32 | Chi (4): path/cluster (valence modified) | B39 | Bond information content (BIC) | |||
| 信息描述符 | A40 | Complementary information content (CIC) | 信息描述符 | B40 | Complementary information content (CIC) | |
| E-STATE键 | A49 | E-state keys (sums): S_dO | B41 | Structural information content (SIC) | ||
| A57 | E-state keys (indicators): I_sCH3 | B42 | Vertex adjacency/magnitude | |||
| 空间描述符 | A69 | Molecular shadow area fraction: XY plane | ||||
| A71 | Molecular shadow area fraction: ZX plane | |||||
| A75 | Molecular shadow ratio | |||||
模型1:
| $ \begin{array}{*{20}{l}} {Y = 19.98 \times {A_9} + 14.63 \times {A_{22}} - 7.45 \times {A_{40}} - }\\ {{\kern 1pt} {\kern 1pt} {\kern 1pt} {\kern 1pt} {\kern 1pt} {\kern 1pt} {\kern 1pt} {\kern 1pt} {\kern 1pt} {\kern 1pt} {\kern 1pt} {\kern 1pt} {\kern 1pt} {\kern 1pt} {\kern 1pt} {\kern 1pt} {\kern 1pt} {\kern 1pt} {\kern 1pt} {\kern 1pt} {\kern 1pt} {\kern 1pt} {\kern 1pt} {\kern 1pt} {\kern 1pt} {\kern 1pt} {\kern 1pt} {\kern 1pt} {\kern 1pt} {\kern 1pt} {\kern 1pt} {\kern 1pt} {\kern 1pt} {\kern 1pt} {\kern 1pt} {\kern 1pt} {\kern 1pt} {\kern 1pt} {\kern 1pt} {\kern 1pt} {\kern 1pt} {\kern 1pt} {\kern 1pt} {\kern 1pt} {\kern 1pt} {\kern 1pt} {\kern 1pt} {\kern 1pt} {\kern 1pt} {\kern 1pt} {\kern 1pt} {\kern 1pt} {\kern 1pt} {\kern 1pt} {\kern 1pt} {\kern 1pt} 59.70 \times {A_{71}} + 98.95} \end{array} $ | (1) |
模型2:
| $ \begin{array}{l} Y = 21.05 \times {A_9} + 15.98 \times {A_{22}} - 5.88 \times {A_{40}} + \\ {\kern 1pt} {\kern 1pt} {\kern 1pt} {\kern 1pt} {\kern 1pt} {\kern 1pt} {\kern 1pt} {\kern 1pt} {\kern 1pt} {\kern 1pt} {\kern 1pt} {\kern 1pt} {\kern 1pt} {\kern 1pt} {\kern 1pt} {\kern 1pt} {\kern 1pt} {\kern 1pt} {\kern 1pt} {\kern 1pt} {\kern 1pt} {\kern 1pt} {\kern 1pt} {\kern 1pt} {\kern 1pt} {\kern 1pt} {\kern 1pt} {\kern 1pt} {\kern 1pt} {\kern 1pt} {\kern 1pt} {\kern 1pt} {\kern 1pt} {\kern 1pt} {\kern 1pt} 78 \times {A_{49}} - 7.38 \times {A_{57}} + 57.99 \end{array} $ | (2) |
模型3:
| $ \begin{array}{*{20}{l}} {Y = 19.91 \times {A_9} + 27.15 \times {A_{22}} - 19.78 \times {A_{24}} + }\\ {13.22 \times {A_{32}} - 8.47 \times {A_{40}} - 9.64 \times {A_{75}} + 72.28} \end{array} $ | (3) |
模型4:
| $ \begin{array}{*{20}{c}} {Y = 17.65 \times {A_9} + 25.53 \times {A_{22}} - 16.82 \times {A_{24}} + }\\ {13.41 \times {A_{32}} - 8.89 \times {A_{40}} - 6.11 \times {A_{57}} - 71.60 \times }\\ {{A_{71}} + 110.84} \end{array} $ | (4) |
模型5:
| $ \begin{array}{*{20}{c}} {Y = 19.10 \times {A_9} + 24.46 \times {A_{22}} - 17.02 \times {A_{24}} + }\\ {11.91 \times {A_{32}} - 6.47 \times {A_{40}} + 0.58 \times {A_{49}} - 7.46 \times }\\ {{A_{57}} - 56.84 \times {A_{71}} + 98.19} \end{array} $ | (5) |
模型6:
| $ \begin{array}{*{20}{c}} {Y = 18.07 \times {A_9} + 25.08 \times {A_{22}} - 16.77 \times {A_{24}} + }\\ {12.49 \times {A_{32}} - 7.86 \times {A_{40}} + 0.55 \times {A_{49}} - 9.63 \times }\\ {{A_{57}} + 41.21 \times {A_{69}} - 93.21 \times {A_{71}} + 97.0} \end{array} $ | (6) |
模型7:
| $ Y = 0.40 \times {B_{40}} + 1.02 \times {B_{41}} - 0.0036 $ | (7) |
模型8:
| $ Y = 0.46 \times {B_{40}} + 1.16 \times {B_{41}} - 0.0049 \times {B_{42}} + 0.010 $ | (8) |
模型9:
| $ \begin{array}{*{20}{l}} {Y = 0.11 \times {B_{26}} + 0.47 \times {B_{40}} + 1.18 \times {B_{41}} - }\\ {{\kern 1pt} {\kern 1pt} {\kern 1pt} {\kern 1pt} {\kern 1pt} {\kern 1pt} {\kern 1pt} {\kern 1pt} {\kern 1pt} {\kern 1pt} {\kern 1pt} {\kern 1pt} {\kern 1pt} {\kern 1pt} {\kern 1pt} {\kern 1pt} {\kern 1pt} {\kern 1pt} {\kern 1pt} {\kern 1pt} {\kern 1pt} {\kern 1pt} {\kern 1pt} {\kern 1pt} {\kern 1pt} {\kern 1pt} {\kern 1pt} {\kern 1pt} {\kern 1pt} {\kern 1pt} {\kern 1pt} {\kern 1pt} {\kern 1pt} {\kern 1pt} {\kern 1pt} {\kern 1pt} {\kern 1pt} {\kern 1pt} {\kern 1pt} {\kern 1pt} {\kern 1pt} {\kern 1pt} {\kern 1pt} 0.0059 \times {B_{42}} + 0.0081} \end{array} $ | (9) |
模型10:
| $ \begin{array}{*{20}{l}} {Y = - 0.067 \times {B_1} + 0.32 \times {B_{39}} + 0.38 \times {B_{40}} + }\\ {{\kern 1pt} {\kern 1pt} {\kern 1pt} {\kern 1pt} {\kern 1pt} {\kern 1pt} {\kern 1pt} {\kern 1pt} {\kern 1pt} {\kern 1pt} {\kern 1pt} {\kern 1pt} {\kern 1pt} {\kern 1pt} {\kern 1pt} {\kern 1pt} {\kern 1pt} {\kern 1pt} {\kern 1pt} {\kern 1pt} {\kern 1pt} {\kern 1pt} {\kern 1pt} {\kern 1pt} {\kern 1pt} {\kern 1pt} {\kern 1pt} 0.66 \times {B_{41}} + 0.0035 \times {B_{42}} + 0.14} \end{array} $ | (10) |
模型11:
| $ \begin{array}{*{20}{l}} {Y = - 0.062 \times {B_1} - 0.032 \times {B_{24}} + 0.30 \times {B_{39}} + }\\ {0.39 \times {B_{40}} + 0.68 \times {B_{41}} - 0.0032 \times {B_{42}} + 0.13} \end{array} $ | (11) |
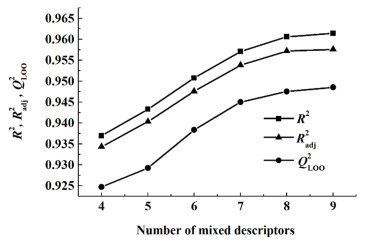
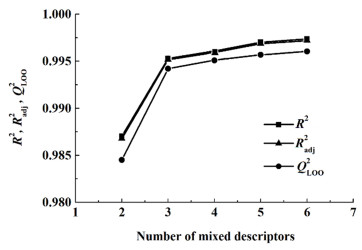
图 2和图 3分别为所建共沸温度及组成预测模型的复相关系数(R2),调整复相关系数(Radj2)和留一法交叉验证系数(QLOO2)与混合描述符个数(n)的变化趋势关系图。从图 2可以看出,当n由4增加到8时,共沸温度预测模型的R2,Radj2和QLOO2曲线稳健上升,而当增加第9个混合描述符时3个参数曲线均变得十分平缓,说明增加第9个混合描述符对模型的拟合能力及稳定性提升不大。从图 3可以看出,当n由2增加到3时,共沸组成预测模型的R2,Radj2和QLOO2曲线急剧上升;当n由3增加到5时,3个参数曲线缓慢上升;当增加第6个混合描述符时参数曲线几乎没有变化;这说明增加第6个混合描述符对模型的拟合能力及稳定性几乎不影响。由此可知,最适宜共沸温度及组成预测模型的最适宜描述符个数是8/5。
|
| 图 2 共沸温度预测模型的描述符个数与R2,Radj2,QLOO2的关系 Fig.2 The relationship between the number of descriptors and R2, Radj2, QLOO2 of azeotropic temperature prediction models |
| |
|
| 图 3 共沸组成预测模型的描述符个数与R2,Radj2,QLOO2的关系 Fig.3 The relationship between the number of descriptors and R2, Radj2, QLOO2 of azeotropic composition prediction models |
| |
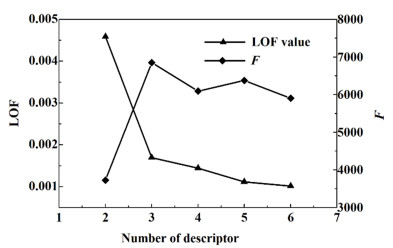
拟合缺失分数(LOF)作为遗传函数算法的适度函数,其变化趋势可用于判断模型是否出现过拟合;而F检验值的大小代表着方程的显著性,F检验值越大则表明该模型的回归假设因果关系显著性越高。图 4和图 5分别是共沸温度及组成预测模型的LOF和F值与混合描述符个数的关系图。由图 4可知,当n由4增加到8时,LOF值随n的增加而快速下降,说明利用8个特征描述符构建的模型不存在过拟合现象;而F检验值随n的增加有略微降低,但当n增加到8时,F值也比较高(280.51),说明混合描述符数为8时,共沸温度模型的回归假设因果关系显著性良好。由图 5可知,当n由2变化到5时,LOF值随n的增加先急剧下降随后逐渐减小,说明利用5个特征描述符数构建的模型不存在过拟合现象,而F检验值随n的增加先快速增加随后在一定范围内波动,当混合描述符数为5时,模型的回归假设因果关系显著性稍弱。综上所述,利用8/5个混合描述符所构建的共沸温度及组成预测模型不存在过拟合问题,且模型的假设因果关系显著性高。

|
| 图 4 共沸温度预测模型的混合描述符个数与LOF和F的关系 Fig.4 The relationship between the number of mixed descriptors and the LOF and F of azeotropic temperature prediction models |
| |
|
| 图 5 共沸组成预测模型的混合描述符个数与LOF和F的关系 Fig.5 The relationship between the number of mixed descriptors and the LOF and F of azeotropic composition prediction models |
| |
表 2给出了最适宜的共沸温度及组成QSPR模型(模型5/模型10)的特征描述符(以下称之为变量)及统计学参数。从表 2中可知,模型5的8个变量的标准系数分别为0.784、0.287、-0.235、0.184、0.156、0.097、0.150和0.104,由此可知其中仅有Chi (5): path/cluster与共沸温度呈负相关;模型10的5个变量的标准系数分别为-0.131、0.252、0.457、0.497和-0.118,由此可知其中Hydroxy和Vertex adjacency/magnitude描述符与共沸组成呈负相关,2个模型各变量的具体数据如附件1表 2和表 3所示。此外,上述的13个变量t-概率值均小于或等于0.005,说明这些变量对含水二元共沸物的共沸温度及组成的影响均是显著的。模型5和模型10的R2和Radj2分别为0.960 6/0.997 0和0.957 2/0.996 9,2个模型的MAE和RMSE的值均较小,分别为1.890 0/0.010 4和2.940 0/0.016 1,说明2个模型分别对训练集共沸温度及组成的实验数据具有较好的拟合能力和预测能力。
| 模型 | 变量 | 描述符 | 相关系数 | 标准系数 | t-值 | t-概率 | 统计学参数 |
| 共沸温度模型 | Constant | 98.192 | 8.765 | 0 | N=101 | ||
| A9 | Hydrogen bond donor | 19.105 | 0.784 | 17.871 | 0 | R2=0.9606 | |
| A22 | Chi (4): path | 24.458 | 0.287 | 9.795 | 0 | Radj2=0.9572 | |
| A24 | Chi (5): path/cluster | -17.018 | -0.235 | -5.668 | 0 | QLOO2=0.9475 | |
| A32 | Chi (4): path/cluster (valence modified) | 11.911 | 0.184 | 4.576 | 0 | LOF=39.88 | |
| A40 | Complementary information content (CIC) | -6.474 | 0.156 | -4.625 | 0 | F=280.51 | |
| A49 | E-state keys (sums): S_dO | 0.581 | 0.097 | 2.883 | 0 | MAE=1.89 | |
| A57 | E-state keys (indicators): I_sCH3 | -7.465 | 0.150 | -4.651 | 0 | RMSE=2.94 | |
| A71 | Molecular shadow area fraction: ZX plane | 56.838 | 0.104 | -3.702 | 0 | Qext2=0.9439 | |
| R2=0.9970 | |||||||
| 共沸组成模型 | Constant | 0.143 | 5.875 | 0 | Radj2=0.9969 | ||
| B1 | Hydroxy | -0.067 | -0.131 | -5.539 | 0 | QLOO2=0.9957 | |
| B39 | Bond information content (BIC) | 0.320 | 0.252 | 6.544 | 0 | LOF=0.0011 | |
| B40 | Complementary information content (CIC) | 0.376 | 0.457 | 28.309 | 0 | F=6 373.60 | |
| B41 | Structural information content (SIC) | 0.663 | 0.497 | 9.739 | 0 | MAE=0.0104 | |
| B42 | Vertex adjacency/magnitude | -0.004 | -0.118 | -9.909 | 0 | RMSE=0.0161 | |
| Qext2=0.9976 |
| 物性 | 模型 | 描述符个数 | 数据集 | 样本数 | R2 | QLOO2 | Qext2 | RMSE | AAE |
| 共沸温度模型 | Shahabadi[29] | 7 | 训练集 | 320 | 0.860 0 | 0.860 0 | 18.300 0 | ||
| 测试集 | 106 | 0.840 0 | 12.110 0 | ||||||
| 数据集 | 426 | ||||||||
| Katritzky[13] | 4 | 训练集 | 320 | 0.755 0 | 0.744 0 | ||||
| 测试集 | 106 | 0.693 0 | |||||||
| 数据集 | 426 | 0.738 0 | 0.730 0 | ||||||
| Solov’ev[10] | 4 | 训练集 | 176 | 0.880 0 | 4.200 0 | ||||
| 测试集 | 12 | 0.840 0 | 3.700 0 | ||||||
| 数据集 | 296 | ||||||||
| 本研究 | 8 | 训练集 | 101 | 0.960 6 | 0.947 5 | 2.941 0 | 1.890 0 | ||
| 测试集 | 24 | 0.943 9 | 3.186 0 | 2.150 0 | |||||
| 数据集 | 125 | 2.990 0 | 1.940 0 | ||||||
| UNIFAC | 99 | 0.720 0 | 7.382 0 | 5.134 0 | |||||
| 共沸组成模型 | Ma[30] | 7 | 训练集 | 64 | 0.870 0 | 0.819 0 | 0.068 0 | ||
| 测试集 | 16 | 0.795 0 | |||||||
| 数据集 | 80 | ||||||||
| Solov’ev[10] | 4 | 数据集 | 80 | ||||||
| 训练集 | 152 | 0.700 0 | 0.096 0 | ||||||
| 测试集 | 24 | 0.320 0 | 0.144 0 | ||||||
| 本研究 | 5 | 训练集 | 101 | 0.997 0 | 0.995 7 | 0.016 1 | 0.010 4 | ||
| 测试集 | 24 | 0.997 6 | 0.060 5 | 0.023 2 | |||||
| 数据集 | 125 | 0.030 2 | 0.012 8 | ||||||
| UNIFAC | 99 | 0.536 0 | 0.158 0 | 0.167 0 |
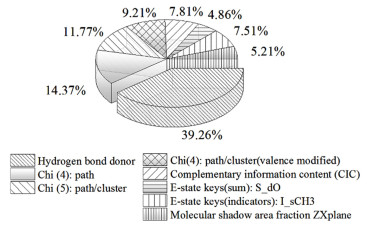
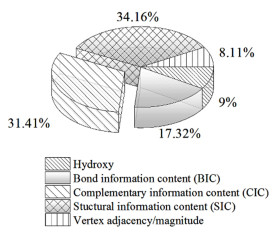
图 6和图 7分别是变量对各QSPR模型的影响占比情况。从图 6可以看出模型5的8个变量对含水二元共沸物共沸温度的影响程度由大到小排序为:Hydrogen bond donor>Chi (4): path>Chi (5): path/cluster>Chi (4): path/cluster (valence modified)>Complementary information content (CIC)>E-state keys (indicators): I_sCH3>Molecular shadow area fraction: ZX plane>E-state keys (sums): S_dO。从图 7中可以看出模型10的5个变量对含水二元共沸物共沸组成的影响程度由大到小排序为Structural information content (SIC)>Complementary information content (CIC)>Bond information content (BIC)>Hydroxy>Vertex adjacency/magnitude。
|
| 图 6 特征描述符对共沸温度预测模型的影响 Fig.6 Effect of each feature descriptors on the optimal azeotropic temperature model |
| |
|
| 图 7 特征描述符对共沸组成预测模型的影响 Fig.7 Effect of each feature descriptors on the optimal azeotropic composition model |
| |
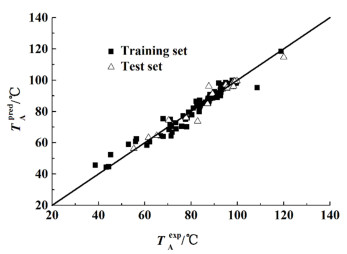
利用留一法交叉验证对模型的内部稳定性进行了分析,2个模型的留一法交叉验证系数QLOO2分别为0.947 5和0.995 7,说明数据的拟合度良好,所建模型非常稳定。在内部验证的基础上进行外部验证能进一步证明模型的真实有效性及外部预测能力,因此,本研究对测试集样本的共沸温度及组成进行了预测。图 8和图 9是共沸温度及组成的实验值与预测值的关系图,从图 8和图 9中可以看出,2个模型的测试集的预测效果和训练集的预测效果一致,散点均位于对角线附近,仅存在1个共沸组成预测数据偏离对角线稍远,2个模型的外部验证系数Qext2分别为0.943 9和0.997 6,说明2个模型的预测准确性高,泛化推广能力好。
|
| 图 8 共沸温度的实验值和预测值的比较 Fig.8 Comparison of experimental and predicted values of azeotropic temperature |
| |

|
| 图 9 共沸组成的实验值与预测值的比较 Fig.9 Comparison of experimental and predicted values of azeotropic composition |
| |
为了排除“偶然相关”的可能,需对2个所建模型进行残差分析。图 10和图 11分别是模型5和模型10的残差关系图,由图 10和图 11可知,2个模型的计算残差均随机且无规律的均匀分布于基准线(0线)两侧,说明在建模过程中均未产生系统误差。同时,可以发现所有残差分布点均集中于基线附近,且大部分离基线较近,这也说明2个模型的预测误差较小。

|
| 图 10 最适宜的共沸温度预测模型的残差与实验值的关系图 Fig.10 The Residuals versus experimental values of the optimal azeotropic temperature prediction model |
| |

|
| 图 11 最适宜的共沸组成QSPR模型的残差与实验值的关系图 Fig.11 The Residuals versus experimental values of the optimal azeotropic composition prediction mode |
| |
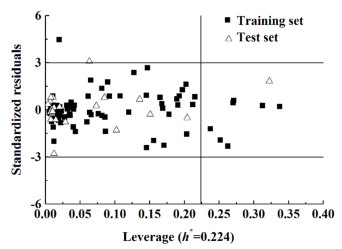
应用域分析最常用的方法是利用标准化残差和leverage值作图,即Williams图[26]。图 12和图 13分别是对模型5和模型10应用域分析的直观呈现图。从图 12可以清晰的看出绝大部分样本落在该应用域以内,只有8个样本落在应用域以外;由图 13可知,只有2个样本落在应用域以外,另外有2个样本落在边界线上。究其原因可能是这类共沸物中有1个分子的某些结构对于整个样本集来说比较特殊。综上可知,最适宜共沸温度及组成模型具有较强的泛化推广能力。
|
| 图 12 最适宜的共沸温度预测模型的应用领域的Williams图 Fig.12 Plot of Williams of AD of the optimal azeotropic temperature prediction model |
| |
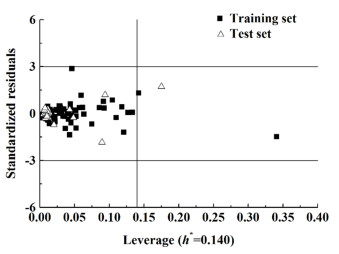
|
| 图 13 最适宜的共沸组成预测模型的应用领域的Williams图 Fig.13 Plot of Williams of AD of the optimal azeotropic composition prediction model |
| |
将这2个模型与同类文献模型及UNIFAC基团贡献法进行比较,表 3列出了不同来源的共沸温度及组成预测模型的主要性能参数。从表 3中可以看出,所建模型所涉及的变量个数与已有模型相近,但是本研究所建模型的R2和QLOO2比其他QSPR模型高,说明本研究所建模型的拟合能力和内部稳定性比其他模型高;从各个模型的外推预测效果来看,可以发现所建模型的Qext2远大于其他模型及UNIFAC基团贡献法,且UNIFAC基团贡献法对一些含水二元共沸体系存在无法计算的问题,即对所选数据集中的26种二元共沸体系都未能计算出共沸温度及组成的预测值,表明所建模型的预测能力和泛化推广能力均优于现有模型,其预测结果数据详见附件1;从各个模型的RMSE和AAE来看,本研究所建模型的RMSE和AAE也远小于其他现有模型,这说明所建模型的预测精度高。综上,可以看出所建立的模型不但拟合能力和内部稳定性有所提高,而且具备较强的预测能力和泛化推广能力。
4 结论本研究基于定量结构-性质关系探究含水二元共沸物的共沸温度及组成与分子结构之间的内在关系,对共沸温度及组成数据进行了预测。得出以下结论:
1) 经分子的三维结构绘制、优化,分子描述符的计算、筛选以及QSPR模型构建与分析比较,确定最适宜的共沸温度预测模型和共沸组成预测模型分别是利用8/5个特征描述符所建立的模型(模型5/模型10),2个模型均具有方程显著性高、不存在过拟合、对实验数据具有良好拟合能力等优点,即含水二元共沸物的共沸温度及组成能被所建模型准确的预测。模型5和模型10的F,LOF,R2,Radj2,RMSE及MAE分别为280.51/6 373.60、39.880 0/0.001 1、0.960 6/0.997 0、0.957 2/0.996 9、2.940 0/0.016 1和1.890 0/0.010 4。
2) 对2个模型分别进行内部验证、外部验证、应用域分析,发现所建的2个模型均具有较强的预测能力和泛化推广性能,其QLOO2和Qext2分别为0.947 5/0.995 7和0.9439/0.997 6。
3) 与同类模型和UNIFAC基团贡献法相比,结果表明,本研究所建共沸温度及组成QSPR模型对测试集样本的预测准确性和泛化推广能力均优于现有模型,可为工程上其他特殊种类的共沸特性数据的获取提供一定的参考和借鉴。
| [1] |
Kim K W, Shin J S, Kim S H, et al. A computational study on the separation of acetonitrile and water azeotropic mixture using pressure swing distillation[J]. Journal of Chemical Engineering of Japan, 2013, 46(5): 347-352. DOI:10.1252/jcej.12we252 |
| [2] |
Li R, Ye Q, Suo X, et al. Heat-Integrated pressure-swing distillation process for separation of a maximum-boiling azeotrope ethylenediamine/water[J]. Chemical Engineering Research and Design, 2016, 105: 1-15. DOI:10.1016/j.cherd.2015.10.038 |
| [3] |
王惠媛.制药工业中两种共沸溶剂分离的模拟与实验研究[D].天津: 天津大学, 2006 Wang Huiyuan. Simulation and experiment for separation of azeotropic solvent mixture in pharmaceutical industry[D]. Tianjin: Tianjin University, 2006(in Chinese) |
| [4] |
Hong S, Park Y, Pore D M. Experimental determination and prediction of phase behavior for 1-butyl-3-methylimidazolium nonafluorobutyl sulfonate and carbon dioxide[J]. Korean Journal of Chemical Engineering, 2014, 31(9): 1656-1660. DOI:10.1007/s11814-014-0097-0 |
| [5] |
Papari M M, Moghadasi J, Fadaei F, et al. Modeling vapor-liquid equilibrium of various binary mixtures with a statistically based equation of state[J]. Journal of Molecular Liquids, 2012, 165: 87-93. DOI:10.1016/j.molliq.2011.10.013 |
| [6] |
Athès V, Paricaud P, Ellaite M, et al. Vapour-Liquid equilibria of aroma compounds in hydroalcoholic solutions:Measurements with a recirculation method and modelling with the NRTL and COSMO-SAC approaches[J]. Fluid Phase Equilibria, 2008, 265(1/2): 139-154. DOI:10.1016/j.fluid.2008.01.012 |
| [7] |
王琦, 严新焕, 陈庚华, 等. 苯-正庚烷-乙醇三元体系加压共沸点的测定与预测[J]. 高校化学工程学报, 1996, 10(1): 71-74. Wang Qi, Yan Xinhuan, Chen Genghua, et al. Determination of ternary azeotropes of benzene heptane ethanol at superatmospheric pressures[J]. Journal of Chemical Engineering of Chinese Universities, 1996, 10(1): 71-74. (in Chinese) |
| [8] |
Seymour K M, Carmichael R H, Carter J, et al. An empirical correlation among azeotropic data[J]. Industrial & Engineering Chemistry Fundamentals, 1977, 16(2): 200-207. |
| [9] |
Yoshimoto T. Studies on azeotropic mixtures. Ⅲ. Physical basis of azeotropic correlation rules[J]. Bulletin of the Chemical Society of Japan, 1957, 30(5): 505-508. DOI:10.1246/bcsj.30.505 |
| [10] |
Solov'ev V P, Oprisiu I, Marcou G, et al. Quantitative structure-property relationship (QSPR) modeling of normal boiling point temperature and composition of binary azeotropes[J]. Industrial & Engineering Chemistry Research, 2011, 50(24): 14162-14167. |
| [11] |
Toropov A A, Raška I Jr, Toropova A P, et al. The study of the index of ideality of correlation as a new criterion of predictive potential of QSPR/QSAR-models[J]. Science of the Total Environment, 2019, 659: 1387-1394. DOI:10.1016/j.scitotenv.2018.12.439 |
| [12] |
Neau E, Escandell J, Nicolas C. Modeling of highly nonideal systems:2. Prediction of high pressure phase equilibria with the group contribution NRTL-PR EoS[J]. Industrial & Engineering Chemistry Research, 2010, 49(16): 7589-7596. |
| [13] |
Katritzky A R, Stoyanova-Slavova I B, Taemm K, et al. Application of the QSPR approach to the boiling points of azeotropes[J]. The Journal of Physical Chemistry A, 2011, 115(15): 3475-3479. DOI:10.1021/jp104287p |
| [14] |
Krisanangkura P, Lilitchan S, Phankosol S, et al. Gibbs energy additivity approaches to QSPR in modelling of isentropic compressibility of biodiesel[J]. Journal of Molecular Liquids, 2018, 249: 126-131. DOI:10.1016/j.molliq.2017.10.150 |
| [15] |
Belhassan A, Chtita S, Lakhlifi T, et al. QSPR study of the retention/release property of odorant molecules in pectin gels using statistical methods[J]. Journal of Taibah University for Science, 2017, 11(6): 1030-1046. DOI:10.1016/j.jtusci.2017.05.004 |
| [16] |
Wang B, Zhou L, Xu K, et al. Fast prediction of minimum ignition energy from molecular structure using simple QSPR model[J]. Journal of Loss Prevention in the Process Industries, 2017, 50: 290-294. DOI:10.1016/j.jlp.2017.10.010 |
| [17] |
Cai G, Liu Z, Zhang L, et al. Quantitative structure-property relationship model for hydrocarbon liquid viscosity prediction[J]. Energy & Fuels, 2018, 32(3): 3290-3298. |
| [18] |
Liang S, Cao Y, Liu X, et al. Insight into pressure-swing distillation from azeotropic phenomenon to dynamic control[J]. Chemical Engineering Research and Design, 2017, 117: 318-335. DOI:10.1016/j.cherd.2016.10.040 |
| [19] |
Ma Y, Cui P, Wang Y, et al. A review of extractive distillation from an azeotropic phenomenon for dynamic control[J]. Chinese Journal of Chemical Engineering, 2019, 27(7): 1510-1522. DOI:10.1016/j.cjche.2018.08.015 |
| [20] |
Zhu Z, Geng X, Li G, et al. Control comparison of extractive distillation with two different solvents for separating acetone and tetrahydrofuran[J]. Process Safety and Environmental Protection, 2019, 125: 16-30. DOI:10.1016/j.psep.2019.03.009 |
| [21] |
程能林. 溶剂手册[M]. 北京: 化学工业出版社, 2015.
|
| [22] |
Zhou L, Wang B, Jiang J, et al. Predicting the gas-liquid critical temperature of binary mixtures based on the quantitative structure property relationship[J]. Chemometrics and Intelligent Laboratory Systems, 2017, 167: 190-195. DOI:10.1016/j.chemolab.2017.06.009 |
| [23] |
Ren Y, Zhang Y, Yao X. QSPRs for estimating nematic transition temperatures of pyridine-containing liquid crystalline compounds[J]. Liquid Crystals, 2018, 45(2): 238-249. |
| [24] |
张尹炎, 潘勇. 基于QSPR方法的烃类物质苯胺点预测[J]. 安全与环境学报, 2015, 15(6): 126-131. Zhang Yinyan, Pan Yong. Forecasting the aniline points of the hydrocarbons based on the analysis of the quantitative structure-property relationship[J]. Journal of Safety and Environment, 2015, 15(6): 126-131. (in Chinese) |
| [25] |
何培, 潘勇, 蒋军成, 等. 芳香族硝基化合物爆速的定量构效关系预测[J]. 中国安全科学学报, 2018, 28(7): 32-37. He Pei, Pan Yong, Jiang Juncheng, et al. Prediction of detonation velocity of nitro aromatic compounds based on quantitative structure-property relationship[J]. China Safety Science Journal, 2018, 28(7): 32-37. (in Chinese) |
| [26] |
江佳佳, 潘勇, 宋晓亚, 等. 三元互溶混合液体闪点预测研究[J]. 化学工程, 2018, 46(2): 23-28. Jiang Jiajia, Pan Yong, Song Xiaoya, et al. Prediction study for flash points of ternary miscible liquid mixtures[J]. Chemical Engineering(China), 2018, 46(2): 23-28. (in Chinese) |
| [27] |
Rogers D, Hopfinger A J. Application of genetic function approximation to quantitative structure-activity relationships and quantitative structure-property relationships[J]. Journal of Chemical Information and Modeling, 1994, 34(4): 854-866. DOI:10.1021/ci00020a020 |
| [28] |
Wang B, Park H, Xu K, et al. Prediction of lower flammability limits of blended gases based on quantitative structure-property relationship[J]. Journal of Thermal Analysis and Calorimetry, 2018, 132(2): 1125-1130. |
| [29] |
Zare-Shahabadi V, Lotfizadeh M, Gandomani A R A, et al. Determination of boiling points of azeotropic mixtures using quantitative structure-property relationship (QSPR) strategy[J]. Journal of Molecular Liquids, 2013, 188: 222-229. DOI:10.1016/j.molliq.2013.09.037 |
| [30] |
Ma Y, Ma K, Wang H, et al. QSPR modeling of azeotropic temperatures and compositions for binary azeotropes containing lower alcohols using a genetic function approximation[J]. Chinese Journal of Chemical Engineering, 2019, 27(4): 835-844. DOI:10.1016/j.cjche.2018.06.031 |
 2020, Vol. 37


